The Forest vs The Long Dark
Reviews on Steam
The Forest
5.2× more reviews
Critical reception
The Forest
6.7pp gap
Estimated sales (median)
The Forest
3.9× more units (white-box estimate)
More recent
The Forest
1 years apart

The Forest
2018 · Action
Endnight Games Ltd · Endnight Games Ltd
- Reviews
- 583,870
- Positive
- 96%
- Launch price
- $19.99
- Engine
- Unknown
- Sales (median)
- 43.8M
- Net rev
- $500.0M
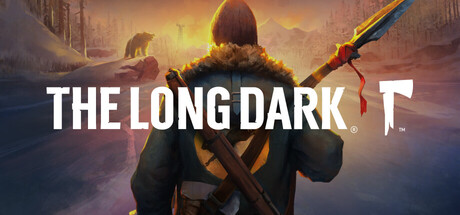
The Long Dark
2017 · Adventure
Hinterland Studio Inc. · Hinterland Studio Inc.
- Reviews
- 112,347
- Positive
- 89%
- Launch price
- $19.99
- Engine
- Unknown
- Sales (median)
- 11.2M
- Net rev
- $128.3M
Tag overlap
75% shared , 15 shared tags, 5 only on The Forest, 5 only on The Long Dark.
Shared
Open World Survival CraftSurvivalOpen WorldCraftingAdventureSurvival HorrorFirst-PersonActionExplorationSandboxSingleplayerAtmosphericSimulationIndieEarly Access
Only The Long Dark
Sales estimates
Paid-game estimates use the same transparent multi-factor Boxleiter method. Free-to-play games never receive paid unit or revenue estimates.
Sales estimate
v1.026.3M to 61.3M
units (median: 43.8M)
≈ $300.0M to $700.0M modeled net revenue (fixed store-cut, refund, and regional-price assumptions applied)
+ - How is this calculated?
| Factor | Adjustment |
|---|---|
| base | +50 |
| year_2018 | +15 |
| price_$20 | 0 |
| positive_96% | +10 |
| final NB | 75 |
Heuristic display range: median × [0.6, 1.4]. Boundary protection: NB ∈ [15, 150].
Methodology & limitations
Sales estimates use an additive Boxleiter-derived heuristic against public Steam review
counts. They are not authoritative sales data, and the fixed display range
is not a statistically validated confidence interval. Actual results may fall outside it,
especially for deeply discounted or bundle-heavy titles. Algorithm version
v1.0. Read the exact method and validation status.
Sales estimate
v1.06.7M to 15.7M
units (median: 11.2M)
≈ $77.0M to $179.6M modeled net revenue (fixed store-cut, refund, and regional-price assumptions applied)
+ - How is this calculated?
| Factor | Adjustment |
|---|---|
| base | +50 |
| year_2017 | +30 |
| price_$20 | 0 |
| positive_89% | +10 |
| genre_Adventure | +10 |
| final NB | 100 |
Heuristic display range: median × [0.6, 1.4]. Boundary protection: NB ∈ [15, 150].
Methodology & limitations
Sales estimates use an additive Boxleiter-derived heuristic against public Steam review
counts. They are not authoritative sales data, and the fixed display range
is not a statistically validated confidence interval. Actual results may fall outside it,
especially for deeply discounted or bundle-heavy titles. Algorithm version
v1.0. Read the exact method and validation status.
How comparison pages work
Verdicts are objective, they call out which game scores higher on a single measurable axis (reviews, price, sales estimate, recency). They don't claim "better." Tag overlap is computed from the public Steam tag list. Sales estimates use a multi-factor Boxleiter method whose formula is shown in full on each game's page.
Want a comparison that doesn't exist? Browse all games,
find two slugs, and concatenate them: /compare/games/<slug-a>/<slug-b>.
Both orderings render the same content; we canonicalise to alphabetical for SEO.